

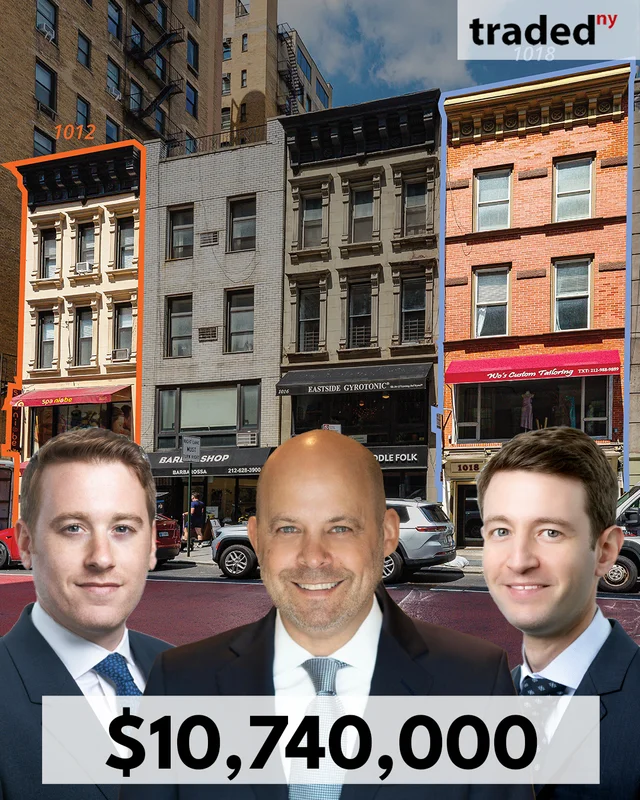
Mark Guindi Of GD Capital Acquires Mixed-use Property From HUBB NYC For $10.74M
1012 Lexington Avenue, 1018 Lexington Avenue & 1429 3rd Avenue
$10,740,000
$928/SF
Building Size
4,420 SF
Asset Type
Mixed-use
Closing
Mar 19, 2026
About this deal
AI
The transaction involved a mixed-use asset located at 1012 Lexington Avenue, 1018 Lexington Avenue & 1429 3rd Avenue in the Upper East Side market. The sale price was set at $10,740,000.
Summary of transaction details:
- Property Type: Mixed-use
- Transaction Amount: $10,740,000
- Buyer: Mark Guindi - GD Capital
- Seller: HUBB NYC
- Brokers: Mitchell Levine, Brent Glodowski & Eric Karmitz - Avison Young
- Transaction Date: 3/20/2026
The deal saw Mark Guindi represent GD Capital as the buyer, while HUBB NYC acted as the seller. The brokerage team from Avison Young included Mitchell Levine, Brent Glodowski, and Eric Karmitz, who facilitated the transaction.
On the Map
$10,740,000
$928/SF
Mixed-use
View full map
Players






New York Mixed-use Market Snapshot
Boundary boundary · Mixed-use · Sale transactions
Loading comparables…
Deal FAQ
Visit Mitchell Levine to view all their deals.
Browse New York mixed use sales on Traded.
Purchase Price
Annual NOI
Loan Amount
Interest Rate (%)
Loan Term (yrs)
Down Payment (%)
Cap Rate
1.48%
Cash-on-Cash
-0.42%
Monthly Payment
$14,164
Annual Debt Svc
$169,964
Annual Cash Flow
$-11,334
DSCR
0.93