

Updated Oct 29, 2024
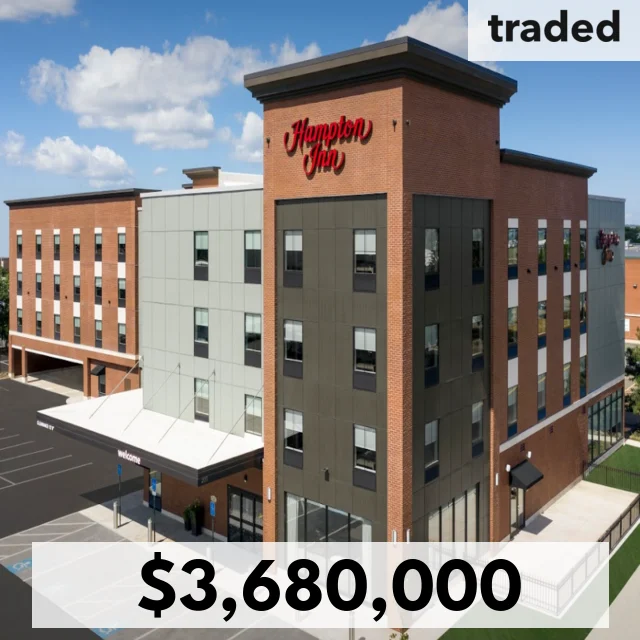
Baywood Hotels Inc. Acquires Industrial Property In Chelsea For $3.68M
200 2nd St, Chelsea, MA, 02150
$3,680,000
$144/SF
Building Size
25,500 SF
Asset Type
Industrial
Closing
Nov 22, 2023
About this deal
AI
The property involved in the transaction is a 25,500 square foot industrial building located at 200 2nd St, Chelsea, MA 02150. The asset was sold for $3,680,000.00. The property is situated on 1.05 acres in the Chelsea market, directly across the street from Mystic Mall.
Summary of transaction details:
- Property Type: Industrial
- Transaction Amount: $3,680,000.00
- Buyer: Baywood Hotels Inc.
- Buyer's Representative: Stephen (Steve) Nohrden
- Seller: 200 Second Street Trust
Additionally, the sale of 200 2nd St. was facilitated by Burgess Properties Inc. with David Corkery and Bruce Lusa of CBRE New England as the brokers. The buyer, Baywood Hotels Inc., is known for being one of the nation's fastest-growing privately-owned hotel management companies and developers. Burgess Properties, founded in 1997, is a prominent commercial brokerage firm in Greater Boston that specializes in office and industrial property sales and leasing.
Players

Chelsea Industrial Market Snapshot
Boundary boundary · Industrial · Sale transactions
Loading comparables…
Deal FAQ
Visit Stephen ( Steve) Nohrden to view all their deals.
Browse Massachusetts industrial sales on Traded.
Purchase Price
Annual NOI
Loan Amount
Interest Rate (%)
Loan Term (yrs)
Down Payment (%)
Cap Rate
4.31%
Cash-on-Cash
-1.23%
Monthly Payment
$14,164
Annual Debt Svc
$169,964
Annual Cash Flow
$-11,334
DSCR
0.93