

Updated Dec 21, 2023
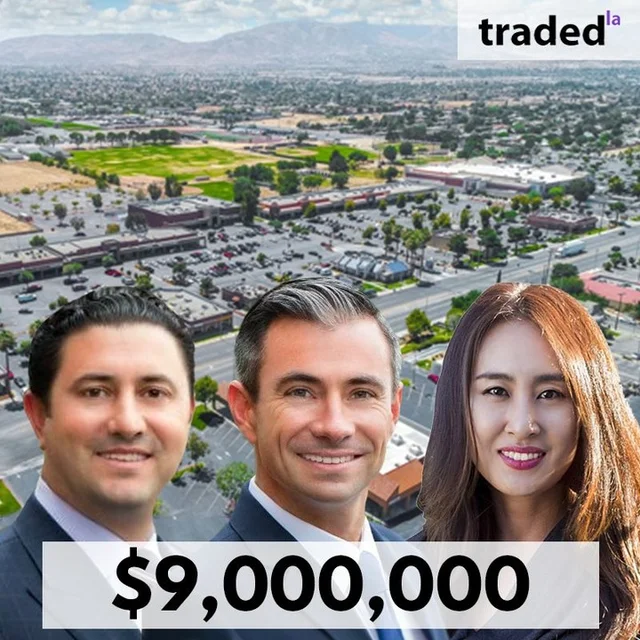
Westside Luxury Real Estate Represents Buyer In $9M Palmdale Retail Sale
2220 E Palmdale Blvd, Palmdale, CA, USA
$9,000,000
$159/SF
Building Size
56,309 SF
Asset Type
Retail
Closing
Feb 8, 2021
About this deal
AI
Located at 2220 E. Palmdale Blvd. in Palmdale, this retail property was recently sold for a price of $9,000,000. The transaction took place on 02/09/2021, with a total square footage of 56,309. With a price per square foot of $159, this retail asset represents a significant investment in the Palmdale market.
Summary of transaction details
- Property Type: Retail
- Transaction Amount: $9,000,000
- Square Footage: 56,309
- Price Per Square Foot: $159
- Buyer's Representative: Joelle Kim - Westside Luxury Real Estate
- Seller's Representatives: Chris Tramontano & John Redfield - SRS Real Estate Partners
The buyer, represented by Joelle Kim from Westside Luxury Real Estate, successfully acquired this retail property. On the other side, the seller was represented by Chris Tramontano and John Redfield from SRS Real Estate Partners. These key individuals and companies played crucial roles in facilitating this transaction, showcasing their expertise in the Palmdale market.
On the Map
$9,000,000
$159/SF
Retail
View full map
Players



Palmdale Retail Market Snapshot
Boundary boundary · Retail · Sale transactions
Loading comparables…
Deal FAQ
Visit Chris Tramontano to view all their deals.
Browse California retail sales on Traded.
Purchase Price
Annual NOI
Loan Amount
Interest Rate (%)
Loan Term (yrs)
Down Payment (%)
Cap Rate
1.76%
Cash-on-Cash
-0.50%
Monthly Payment
$14,164
Annual Debt Svc
$169,964
Annual Cash Flow
$-11,334
DSCR
0.93