

Aug 11, 2026
What Buffalo and San Jose Tell Us About SFR Rent Growth in 2026
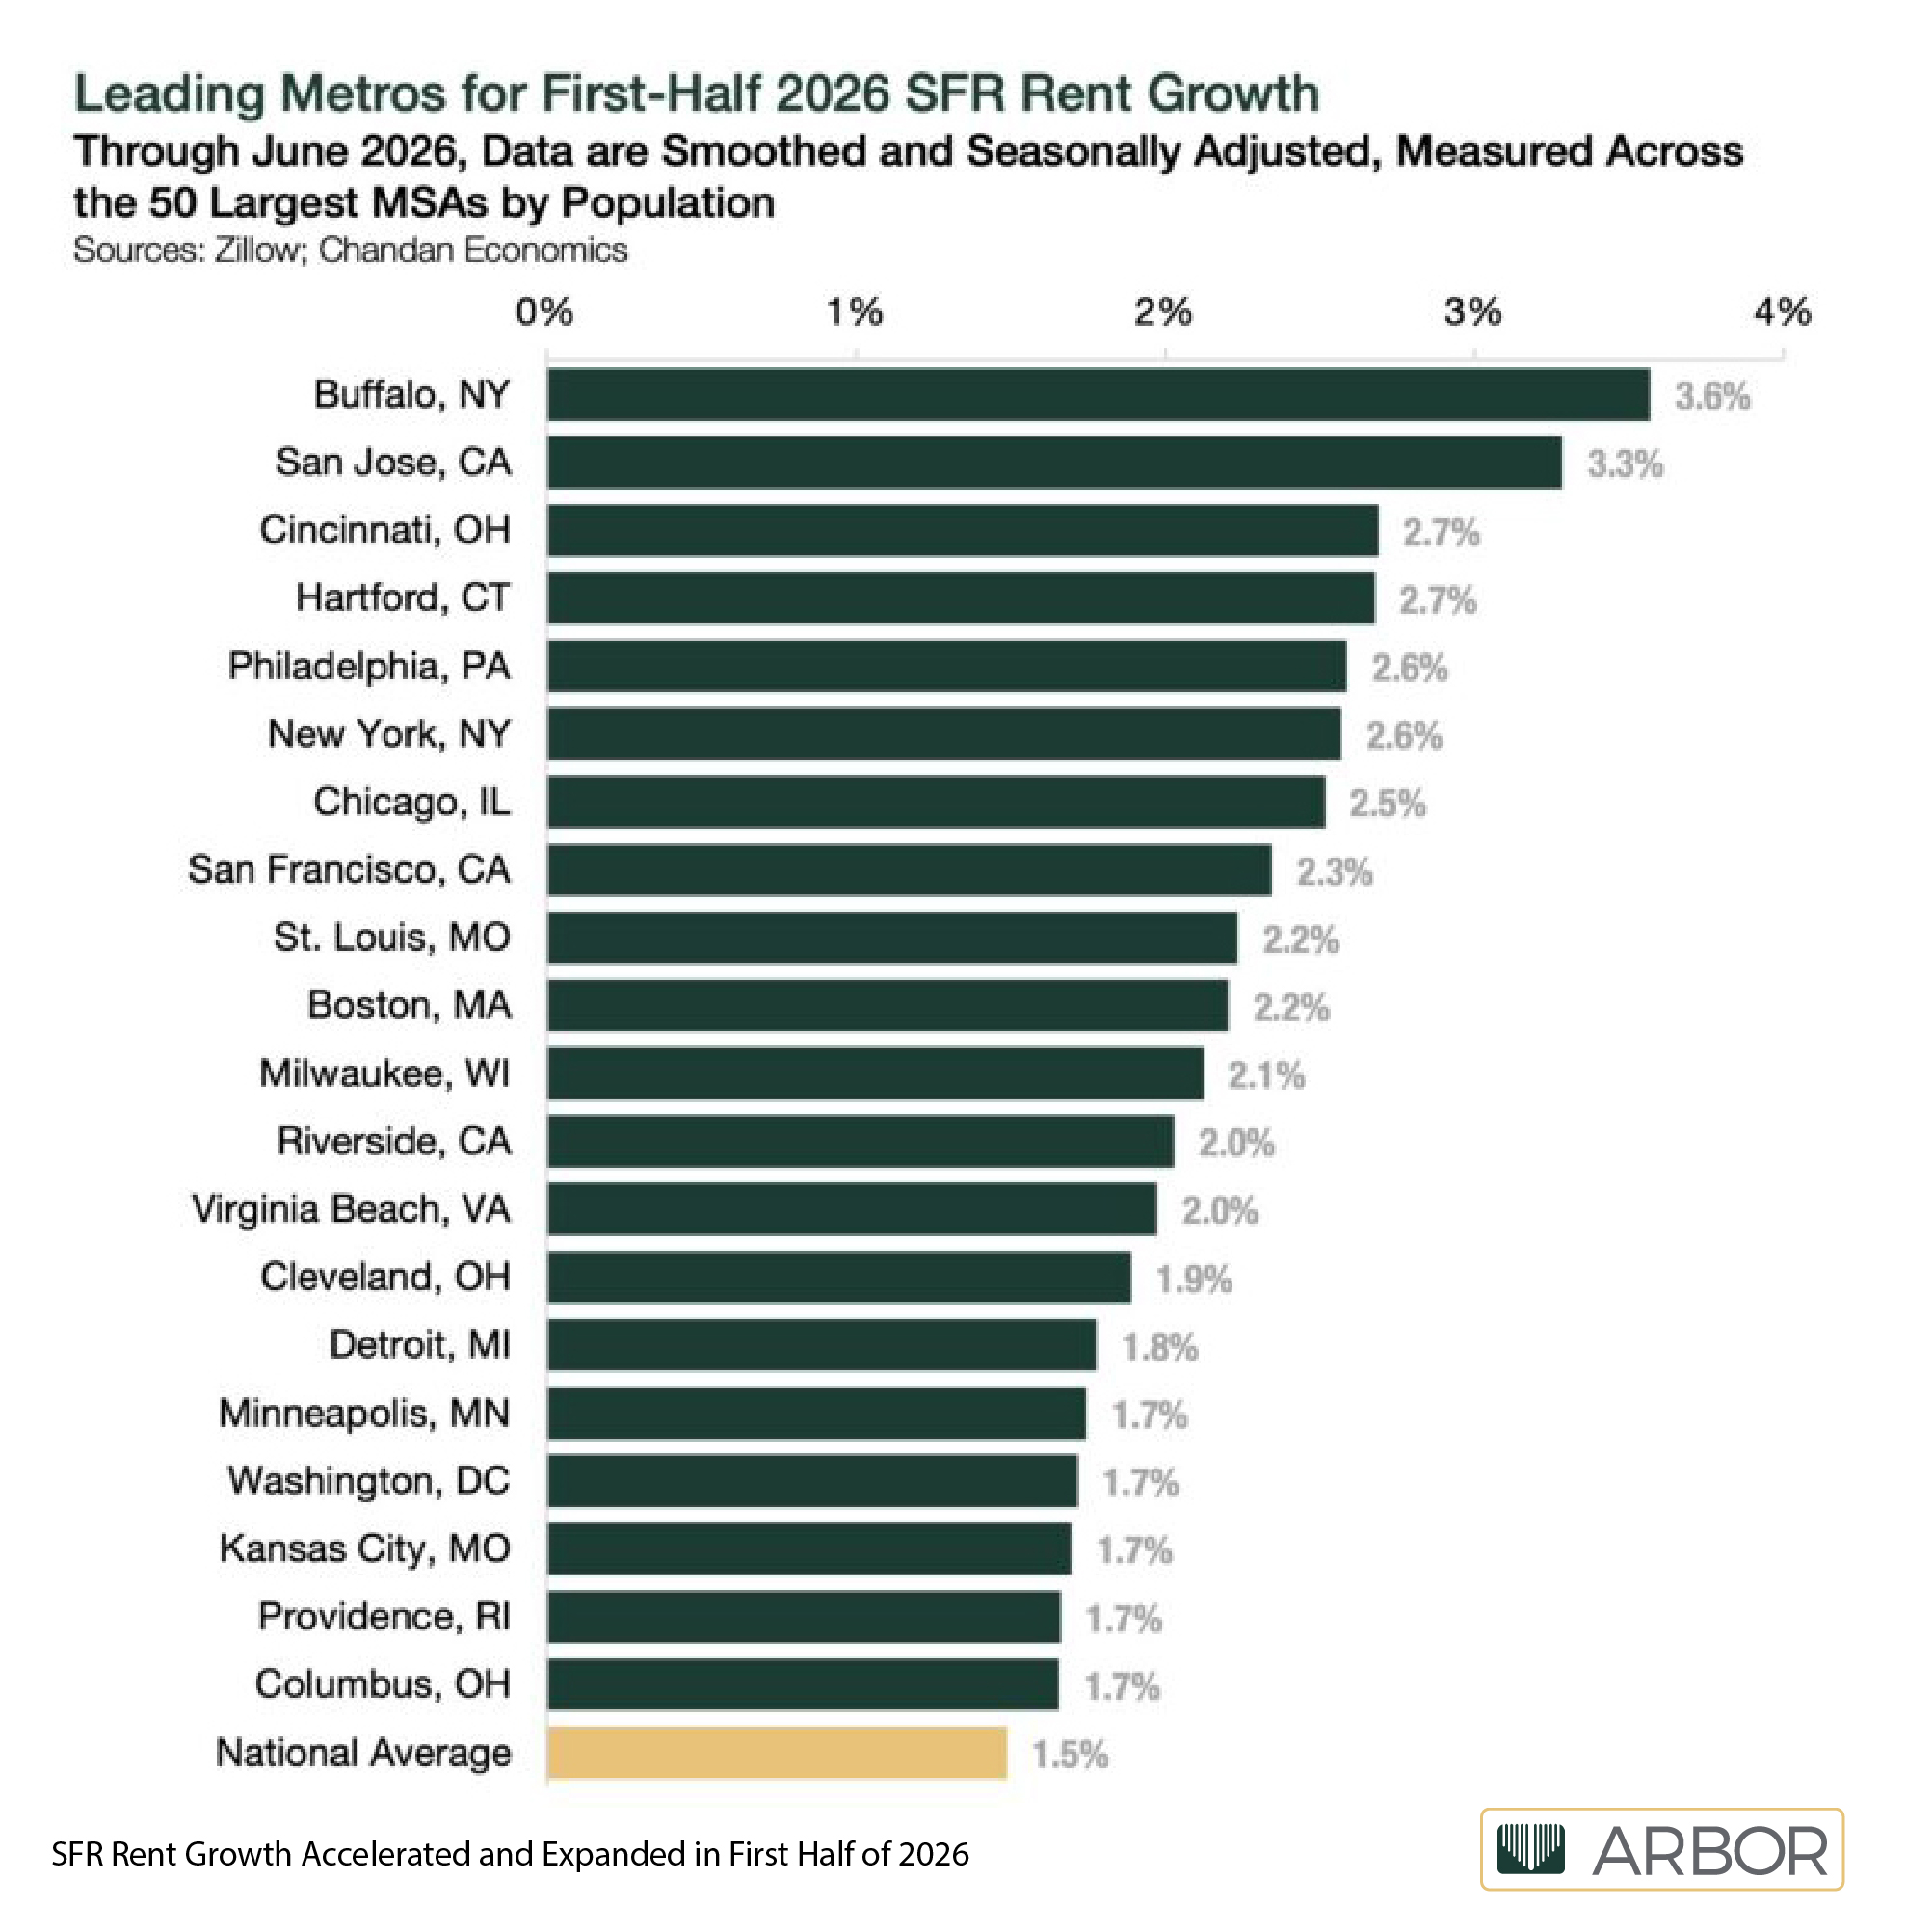
Buffalo, NY, and San Jose, CA, led all 50 of the largest U.S. metros in single-family rental rent growth during the first half of 2026, at 3.6% and 3.3% respectively, according to new research from Arbor Realty Trust.


Traded Editorial
Key Points
- Buffalo, NY, and San Jose, CA, ranked first and second for single-family rental rent growth among the 50 largest U.S. metropolitan areas in the first half of 2026, reaching the top from very different starting points.
- Northeast and Midwest metros accounted for eight of the 10 leading markets, while several major Sun Belt markets posted more modest gains.
- Rent growth broadened well beyond the largest metros, with the share of tracked markets recording monthly increases reaching its highest level of 2026 in June.
- Buffalo and San Jose show that strong SFR rent growth can result from different combinations of affordability, housing scarcity, renter incomes, and supply constraints.
What the Data Shows
Buffalo, NY, and San Jose, CA, ranked first and second for single-family rental (SFR) rent growth during the first half of 2026, according to new research from Arbor Realty Trust and Chandan Economics. Buffalo led all 50 of the largest U.S. metropolitan areas at 3.6%, with San Jose second at 3.3%.
The two, however, differ sharply.
Buffalo is among the more affordable of the large U.S. metros. San Jose is the most expensive SFR market among the 50 largest, where the average single-family home rents for $4,794 per month.
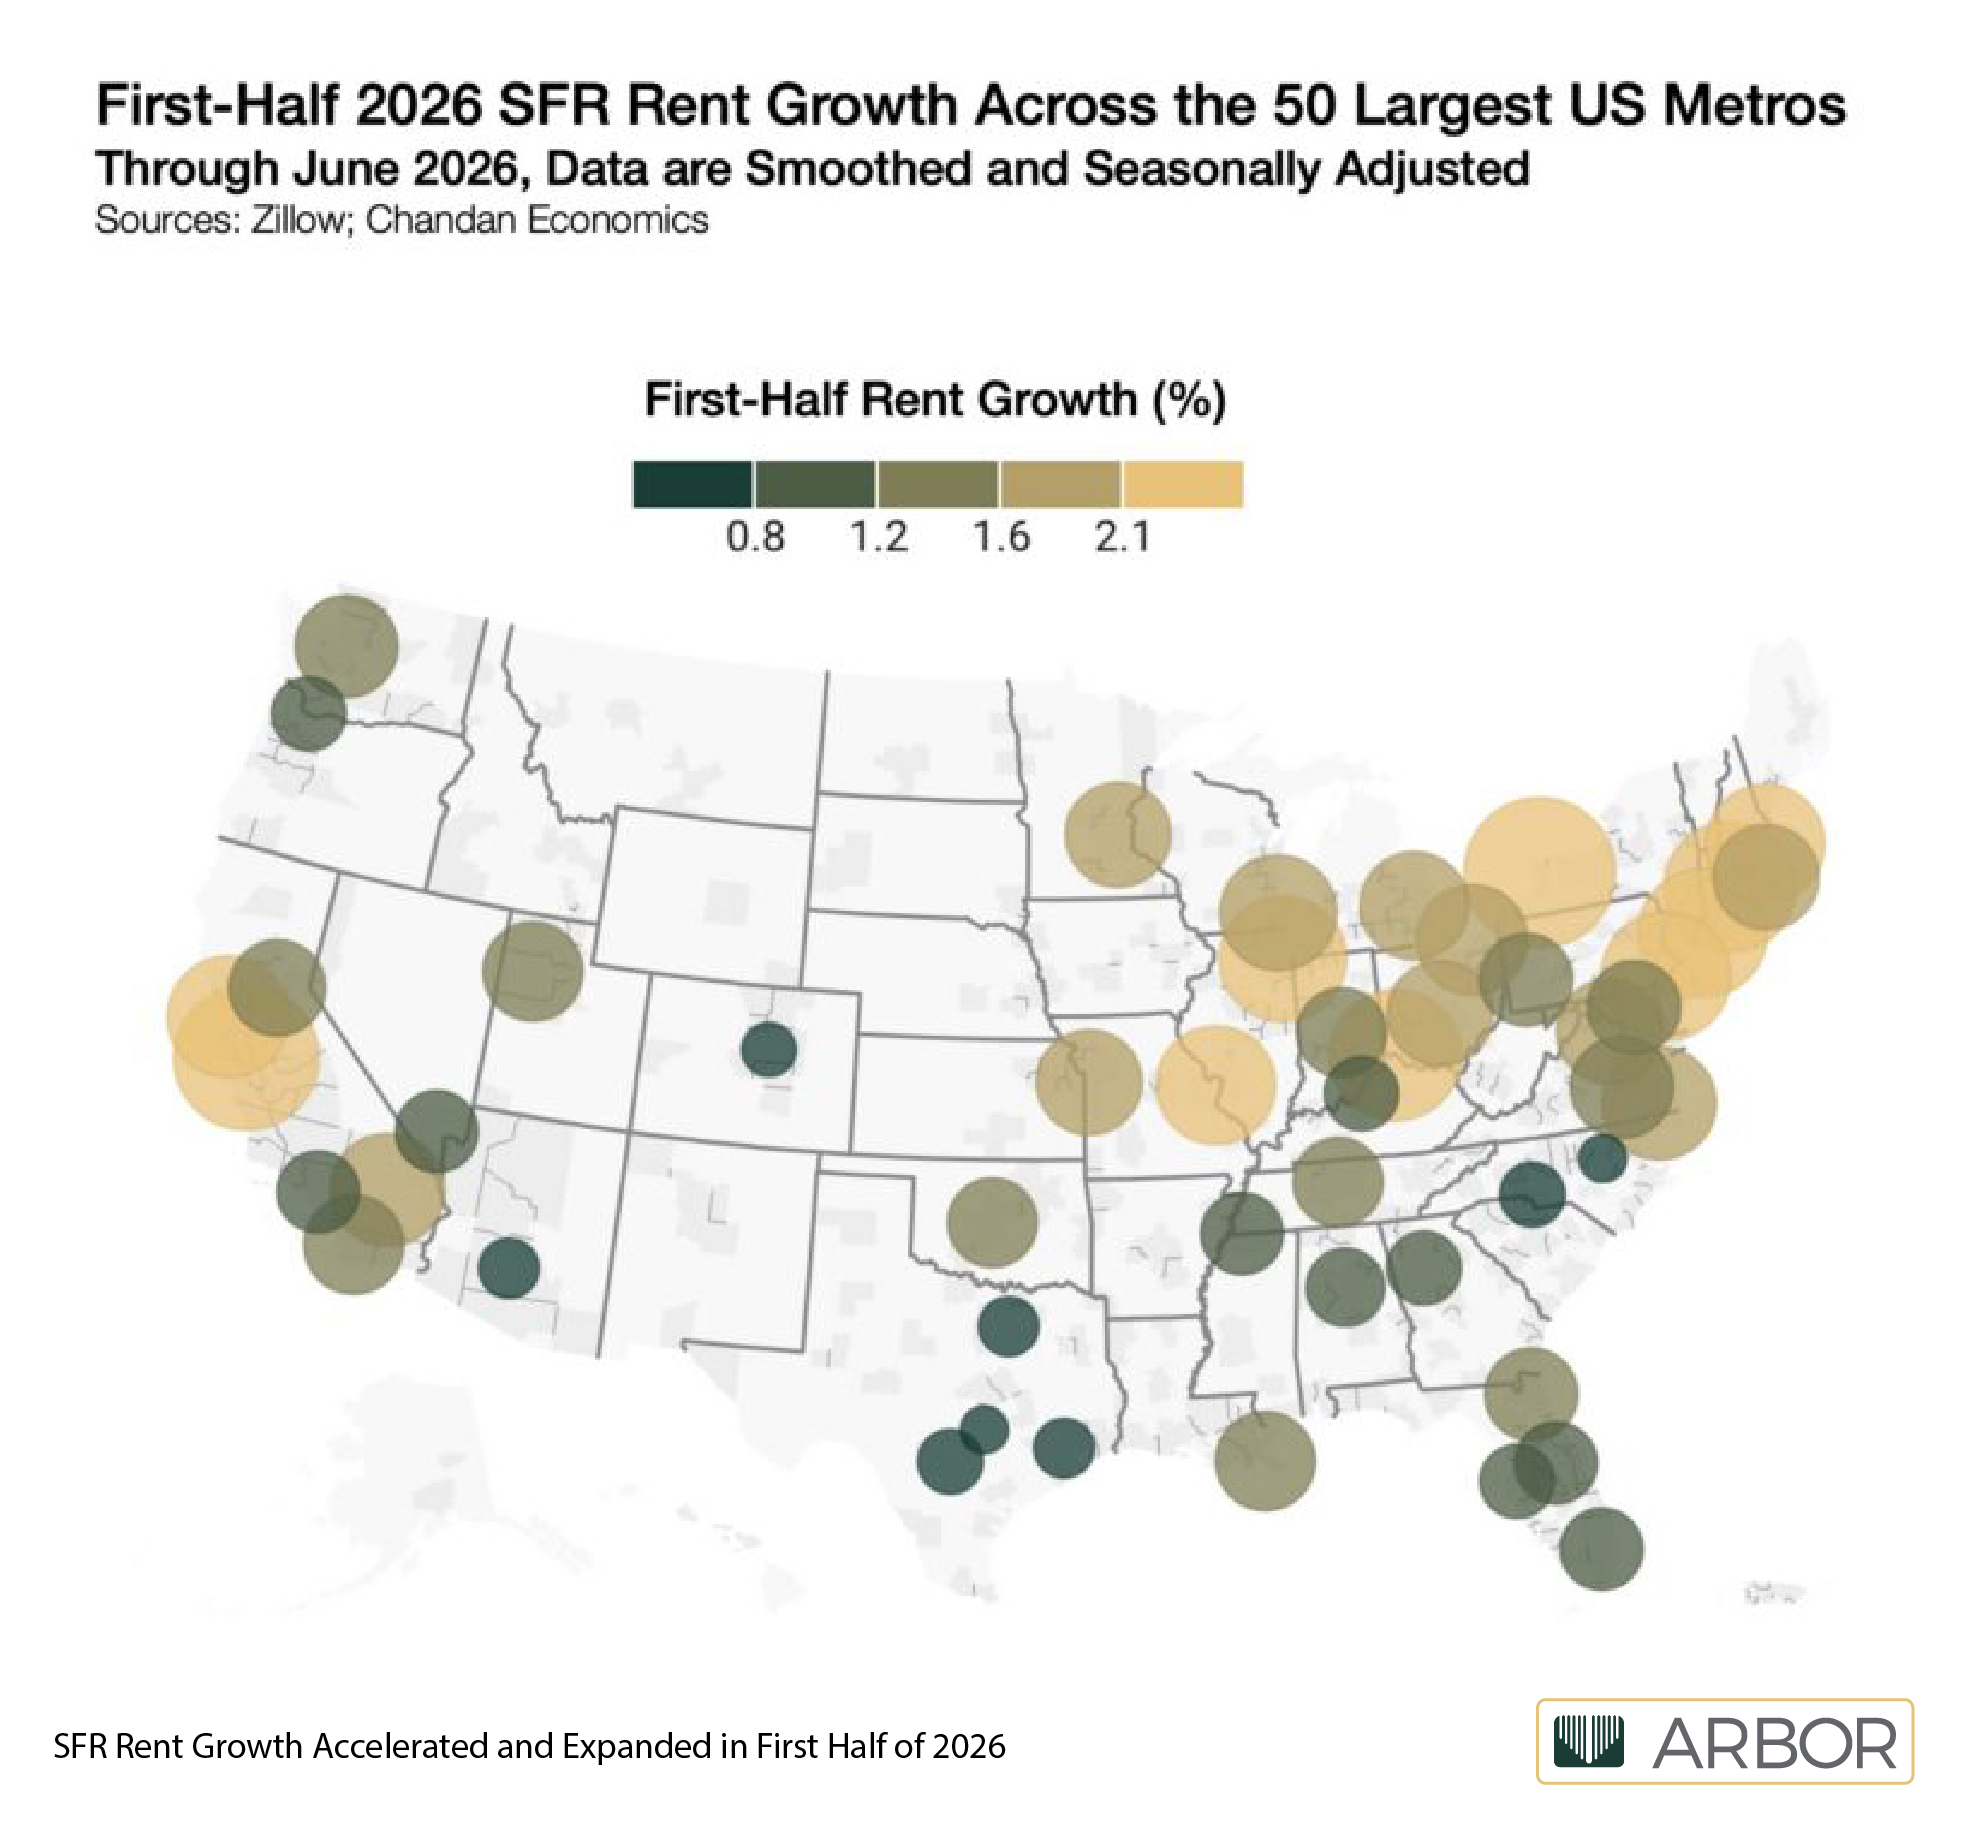
Between December 2025 and June 2026, rents rose in all 50 of the largest metros, ranging from 0.3% in the slowest markets to 3.6% in Buffalo. The differences in the growth rates of SFR markets shed light on how local conditions contribute to investment performance.
Buffalo’s 1st-Place Finish Part of a Regional Pattern
Buffalo is not an outlier. It’s a strong example of a regional trend.
Cincinnati, OH, and Hartford, CT, tied for third at 2.7%. New York, NY, and Philadelphia, PA, followed at 2.6%, while Chicago, IL, recorded 2.5%. In total, eight of the 10 fastest-growing large metros were in the Northeast or Midwest.
That concentration should change how investors interpret Buffalo’s performance. Strong SFR rent growth in the Northeast and Midwest may reflect steady demand from households already in place rather than unusually strong inbound migration. Renters who are priced out of homeownership, or who are simply staying in rental housing longer, can keep absorption steady and rapid rent growth in check.
How Supply Conditions Support Pricing Power in Buffalo
Supply conditions may be another important part of the equation. Slower construction activity and more limited additions to the rental housing stock can result in fewer completions competing for the same renters.
Mature Northeast and Midwest markets tend to differ from high-growth Sun Belt markets in several respects:
- Fewer large-scale housing developments
- More constrained or aging housing stock
- Less rapid expansion of rental supply
The bottom of the rankings reinforces the point. Austin, TX, and Raleigh, NC, recorded the slowest SFR rent growth of the 50 largest metros at 0.3%, followed by Denver, CO, at 0.4%. Dallas, TX; Houston, TX; and Phoenix, AZ each posted 0.5%.
These are markets with strong employment and population growth. They also have absorbed significant new supply, which may be contributing to slower rent growth. For investors accustomed to underwriting rent growth primarily as a function of job and population gains, first-half results in Arbor’s research report suggest that supply conditions warrant greater weight.
Why San Jose’s High-Income Renters Support Demand
San Jose’s 3.3% growth is notable in part because of where it started. Percentage growth applied to a $4,794 average rent translates into a substantial increase in actual monthly housing costs. But tightness in the local rental market suggests affordability pressure has not yet displaced demand.
San Jose’s employment base is central to how the local market sustains those rent levels. Several factors support that dynamic:
- A concentration of technology and professional services employment
- Household incomes well above those in most U.S. markets
- Demand from workers who place a premium on proximity to major employment centers
- Mobile or career-focused households that may prefer renting over buying
Homeownership barriers reinforce the effect. In a market where for-sale housing is largely out of reach even for many high earners, renting functions less as a temporary step toward ownership and more as a durable housing choice.
San Jose is not alone. San Francisco, CA, ranked among the leading markets at 2.3%, putting two Northern California metros in the top 10 and making the region a notable exception to the broader Northeast and Midwest pattern.
Rent Growth is Reaching More Markets
The trend extended well beyond the largest metros. In June, 456 of the 602 tracked markets recorded monthly rent increases, lifting the share with rising rents to 75.7%, the highest level of 2026.
That reading was 11.2 percentage points above the recent low of 64.5% in May 2025 and up from 69.4% in December 2025, indicating that positive momentum became more widely distributed during the first half of the year.
Despite recent gains, there remains room to grow. The share of markets with rising rents averaged 80.3% from 2016 through 2019, approximately 4.6 percentage points above the June 2026 level. The gap suggests the sector has begun normalizing toward its pre-pandemic baseline.
Beyond the Rankings
A national SFR thesis is not sufficient on its own. Markets with similar headline growth rates may be reaching them through very different dynamics, making market-level analysis essential.
As momentum broadens, performance remains highly differentiated, and market selection will require greater attention to local fundamentals. Headline growth rates identify where momentum exists, but local rent trends, supply conditions, household incomes, and property economics remain central to assessing a market’s investment potential.