

Updated Jan 15, 2026
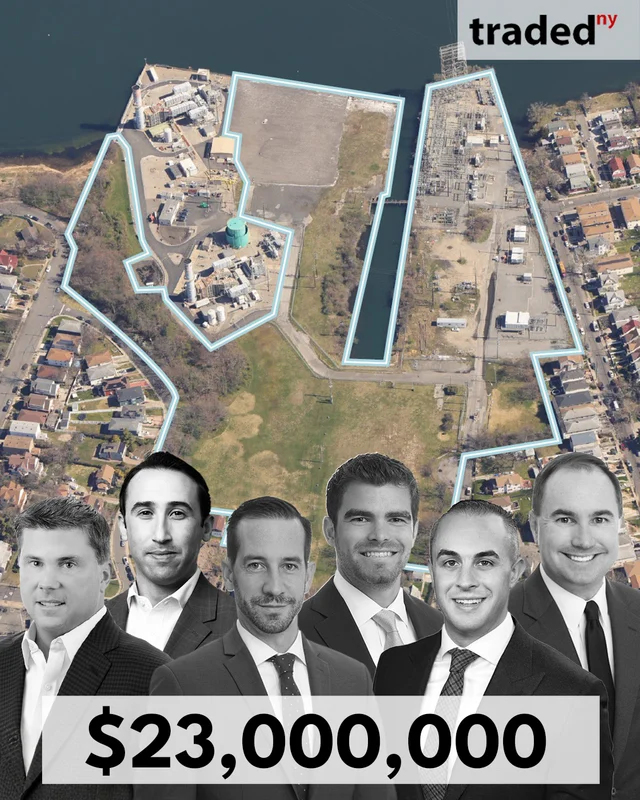
Long Island Power Authority Purchases Development Site From National Grid For $23M In Far Rockaway
Mott Avenue
$23,000,000
$39/SF
Building Size
583,702 SF
Asset Type
Development Site
Closing
Dec 28, 2025
About this deal
AI
The development site located at Mott Avenue and Bay 24th Street in Far Rockaway was sold for $23,000,000. The property spans a total area of 583,702 square feet, equating to a price per square foot of $39.
Summary of transaction details:
- Property Type: Development Site
- Transaction Amount: $23,000,000
- Buyer: Long Island Power Authority (LIPA)
- Seller: National Grid
- Brokers: Brendan Callahan, Ethan Stanton, Hall Oster, Tyler Peck, Michael Mazzara & Brendan Maddigan - JLL
The transaction involved key representatives from JLL who facilitated the deal, ensuring a smooth process between the Long Island Power Authority and National Grid, highlighting the expertise and coordination of the brokers involved in this significant transaction.
On the Map
$23,000,000
$39/SF
Development Site
View full map
Players








Far Rockaway Development Site Market Snapshot
Boundary boundary · Development Site · Sale transactions
Loading comparables…
Deal FAQ
Visit Tyler Peck to view all their deals.
Browse Far Rockaway development site sales on Traded.
Purchase Price
Annual NOI
Loan Amount
Interest Rate (%)
Loan Term (yrs)
Down Payment (%)
Cap Rate
0.69%
Cash-on-Cash
-0.20%
Monthly Payment
$14,164
Annual Debt Svc
$169,964
Annual Cash Flow
$-11,334
DSCR
0.93