

Updated Sep 4, 2025
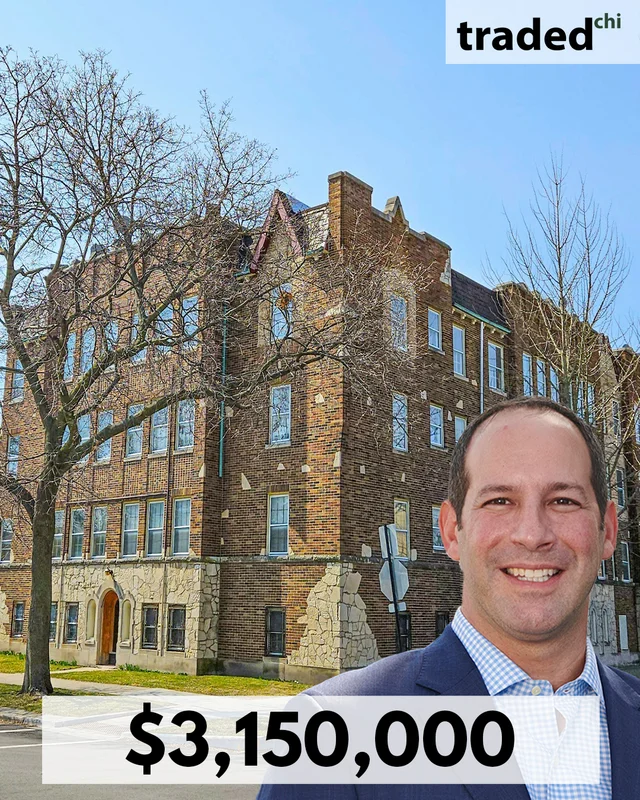
6254 North Whipple Street Multifamily Sold For $3.15 Million By Brad Feldman Of Interra Realty
6254 North Whipple Street
$3,150,000
Units
16
Asset Type
MultiFamily
Closing
Sep 4, 2025
About this deal
AI
The asset involved in this transaction is a fully leased 16-unit apartment building located at 6254 North Whipple Street in Chicago's West Ridge neighborhood. The property was sold for $3,150,000, equating to a price per unit of $196,875. The seller of this asset had previously acquired it for $1,800,000 in 2023 and completed major renovations, resulting in a significant increase in the property's value over two years.
Summary of transaction details:
- Property Type: MultiFamily
- Transaction Amount: $3,150,000
- Units: 16
- Price Per Unit: $196,875
- Broker: Brad Feldman - Interra Realty
Brad Feldman represented the transaction through Interra Realty, facilitating the sale of the property managed by a seller who successfully enhanced the asset's market value after extensive renovations.
On the Map
$3,150,000
MultiFamily
View full map
Players



Chicago MultiFamily Market Snapshot
Boundary boundary · MultiFamily · Sale transactions
Loading comparables…
Deal FAQ
Visit Brad Feldman to view all their deals.
Browse Chicago multifamily sales on Traded.
Purchase Price
Annual NOI
Loan Amount
Interest Rate (%)
Loan Term (yrs)
Down Payment (%)
Cap Rate
5.04%
Cash-on-Cash
-1.44%
Monthly Payment
$14,164
Annual Debt Svc
$169,964
Annual Cash Flow
$-11,334
DSCR
0.93