

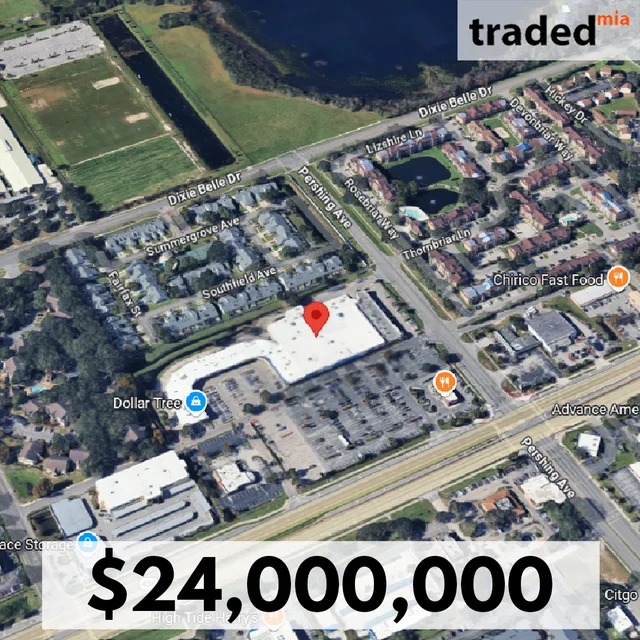
Core Investment Management Fund Sells Shoppes Of South Semoran In Orlando For $24M
4520 Semoran Boulevard
$24,000,000
$237/SF
Building Size
101,000 SF
Asset Type
Retail
Closing
Jul 28, 2025
About this deal
AI
The retail asset located at 4520 Semoran Boulevard in Orlando comprises 101,000 square feet and was sold for $24,000,000. The property is currently 99% leased and serves as the Shoppes of South Semoran, anchored by Walmart Neighborhood Market.
Summary of transaction details:
- Property Type: Retail
- Transaction Amount: $24,000,000
- Square Footage: 101,000
- Address: 4520 Semoran Boulevard
- Market: Orlando
- Seller: Adam Greenberg - Core Investment Management Fund
- Broker: Whitaker Leonhardt - Colliers
- Price Per Square Foot: $238
Core Investment Properties Fund previously acquired the property for $18,000,000 in 2020. The transaction was facilitated by Colliers, representing the seller in this closed deal with an undisclosed buyer.
On the Map
$24,000,000
$237/SF
Retail
View full map
Players



Orlando Retail Market Snapshot
Boundary boundary · Retail · Sale transactions
Loading comparables…
Deal FAQ
Visit Whitaker Leonhardt to view all their deals.
Browse Orlando retail sales on Traded.
Purchase Price
Annual NOI
Loan Amount
Interest Rate (%)
Loan Term (yrs)
Down Payment (%)
Cap Rate
0.66%
Cash-on-Cash
-0.19%
Monthly Payment
$14,164
Annual Debt Svc
$169,964
Annual Cash Flow
$-11,334
DSCR
0.93