

Updated Oct 28, 2024
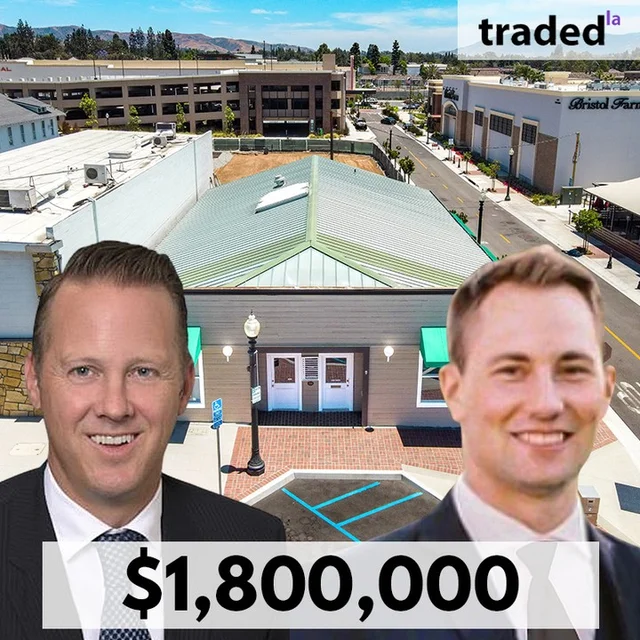
Matt Luke's Longball Investments LLC Acquires Retail Property In Yorba Linda For $1.8M
4858 Main Street, Yorba Linda, California 92886, United States
$1,800,000
$459/SF
Building Size
3,920 SF
Asset Type
Retail
Closing
Mar 9, 2022
About this deal
AI
The retail property located at 4858 Main St, Yorba Linda CA 92886 in Orange County has been sold for $1,800,000. The property spans 3,920 square feet and was sold at a price of $459 per square foot.
Summary of transaction details
- Property Type: Retail
- Transaction Amount: $1,800,000
- Market: Orange County
- Buyer: Matt Luke - Longball Investments LLC
- Seller: Harry Schlitz, Dave Hutchison & Nancy Parsell
- Brokers: Jamie Harrison & Chris Manassero - Lee & Associates
Matt Luke, representing Longball Investments LLC, purchased the property from sellers Harry Schlitz, Dave Hutchison, and Nancy Parsell. The deal was facilitated by brokers Jamie Harrison and Chris Manassero from Lee & Associates.
On the Map
$1,800,000
$459/SF
Retail
View full map
Players



Yorba Linda Retail Market Snapshot
Boundary boundary · Retail · Sale transactions
Loading comparables…
Deal FAQ
Visit Jamie Harrison to view all their deals.
Browse California retail sales on Traded.
Purchase Price
Annual NOI
Loan Amount
Interest Rate (%)
Loan Term (yrs)
Down Payment (%)
Cap Rate
8.81%
Cash-on-Cash
-2.52%
Monthly Payment
$14,164
Annual Debt Svc
$169,964
Annual Cash Flow
$-11,334
DSCR
0.93